20. KCuF3 - II    |


|
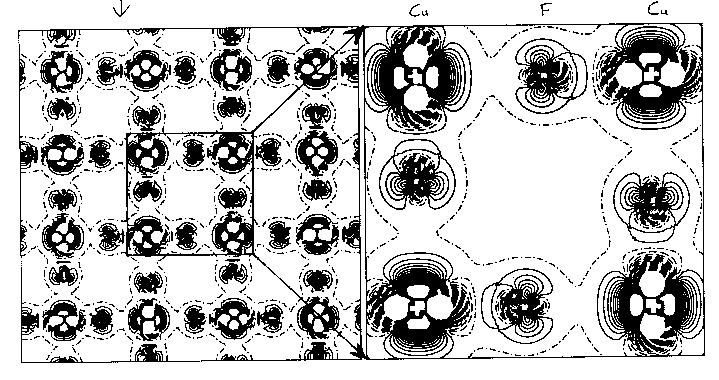
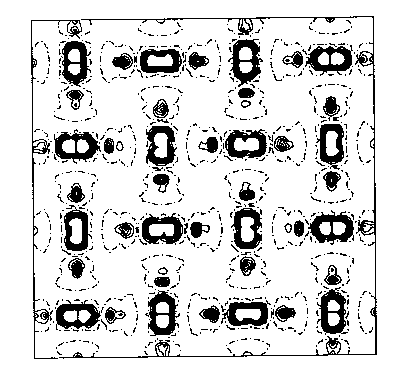
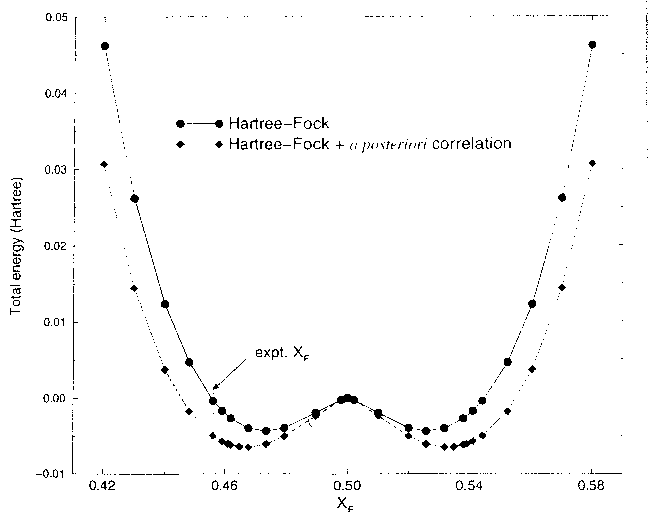
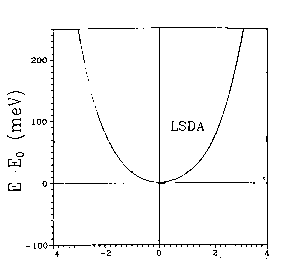
You can see this more clearly on the two-dimensional plots above, which are from HF calculations of KCuF3. The first one is a charge density difference plot (i.e. the difference between the actual crystal charge density and a superposition of spherical atomic densities) in the basal plane which shows the distortions of the ions from spherical symmetry due to the crystalline environment. Below that we see a two dimensional spin density plot over the same plane - you can see that adjacent Cu ions have orthogonal lobes of unpaired spin density.. First question: is the crystal unstable with respect to a cooperative Jahn-Teller distortion in our calculations? Yes, the third diagram is a plot of the total energy with respect to the Jahn-Teller displacement coordinate. The value 0.5 on the x axis corresponds to the fluorine being in the middle of the bond. As we move it away we see the symetric structure is unstable and you get this classic JT double well. I should explain what the two curves are. The upper curve is HF, the bottom curve is HF plus an a posteriori correlation energy estimate. (Since a correlation density functional is just an equation in terms of the spin densities you can feed the converged HF spin densities (which we normally expect to be pretty similar to a good DFT result) into it and get out an estimate of the correlation energy. This is theoretically dodgy but sometimes useful.. The minimum is pretty close to the experimental fluorine position marked on the picture. The final picture is the result of the same calculation using the LSDA (due to Lichtenstein and others, if I remember rightly). You see quite clearly (because we don't have a mechanism for orbital polarization in LSDA) that the crystal is stable with respect to a Jahn-Teller distortion, which is not correct. This is a particularly nice example of a calculation of a strongly correlated material where the LSDA gives qualitatively wrong answers for properties other than band gaps.. |


